We have reached the end of the ‘political year’ – May elections to May elections. Over the last year, there have been 245 by elections (this includes only those NOT fought alongside the local elections on the first Thursday in May).
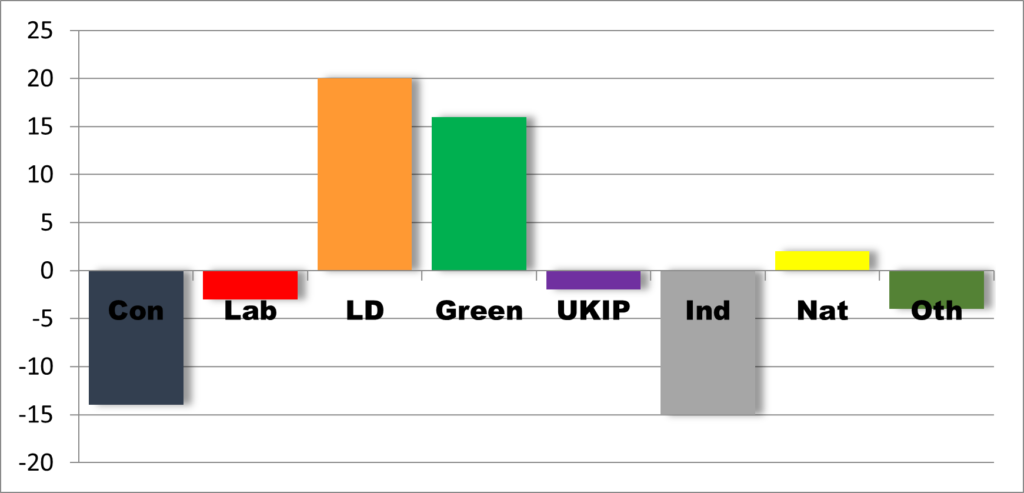
Over the 12 months, the Liberal Democrats have done well, and increasingly so as the year has progressed. Conversely, the Conservatives have done worse. The chart below sees us with a net 20 gains, with the Greens in second place.
LD +20 Green +16 Nat +2 UKIP -2 Lab -3 Oth -4 Con -14 Ind -15
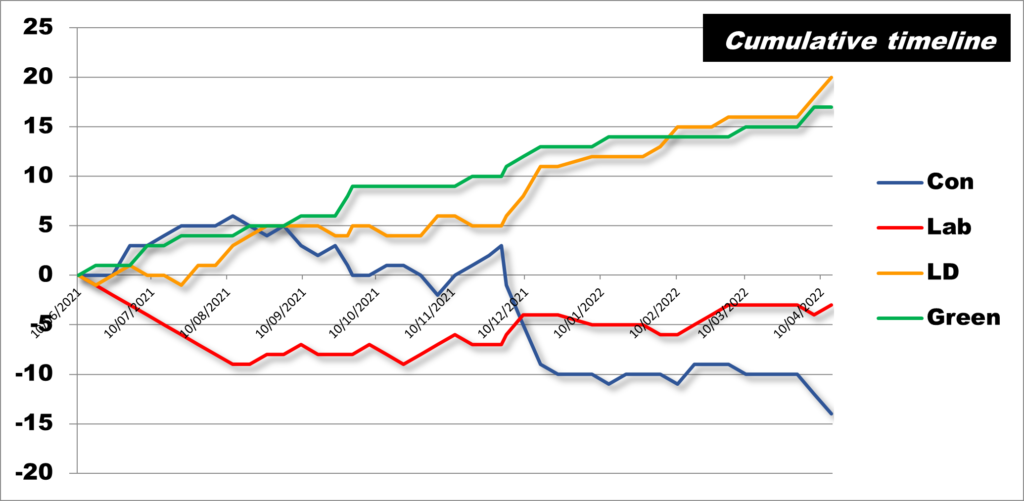
Labour continue to underperform. Over the year, they have gained 6 seats from the Tories but lost 9 back to them. By contrast, the Lib Dems gained 19 from the Tories and lost back 6, while the Greens won 13 from them but lost none back. The timeline for net changes over the year is:
The Conservatives were bumping along about even until ‘Partygate’ came along. Along with our parliamentary by election victory in North Shropshire, we saw the Tories drop off a cliff edge. At the same time, our rate of gain took off.
For Labour, their main battle has been against the Tories. Us and the Greens have only managed a net of 2 gains against Labour each.
What does this suggest for the local elections? Well, the Conservatives are likely to lose badly, and we should continue to push hard in our Conservative target and development seats. Labour remain tougher opponents for us, in particular in Metropolitan areas. We will need to keep the foot to the pedal in both defences against Labour and in any target seats.
Figures from John Swarbrick

